How Population Data Guides Feature Adjustments in Computerized Wagering Models
Petra Schmitz · Aug 21, 2026
How Population Data Guides Feature Adjustments in Computerized Wagering Models
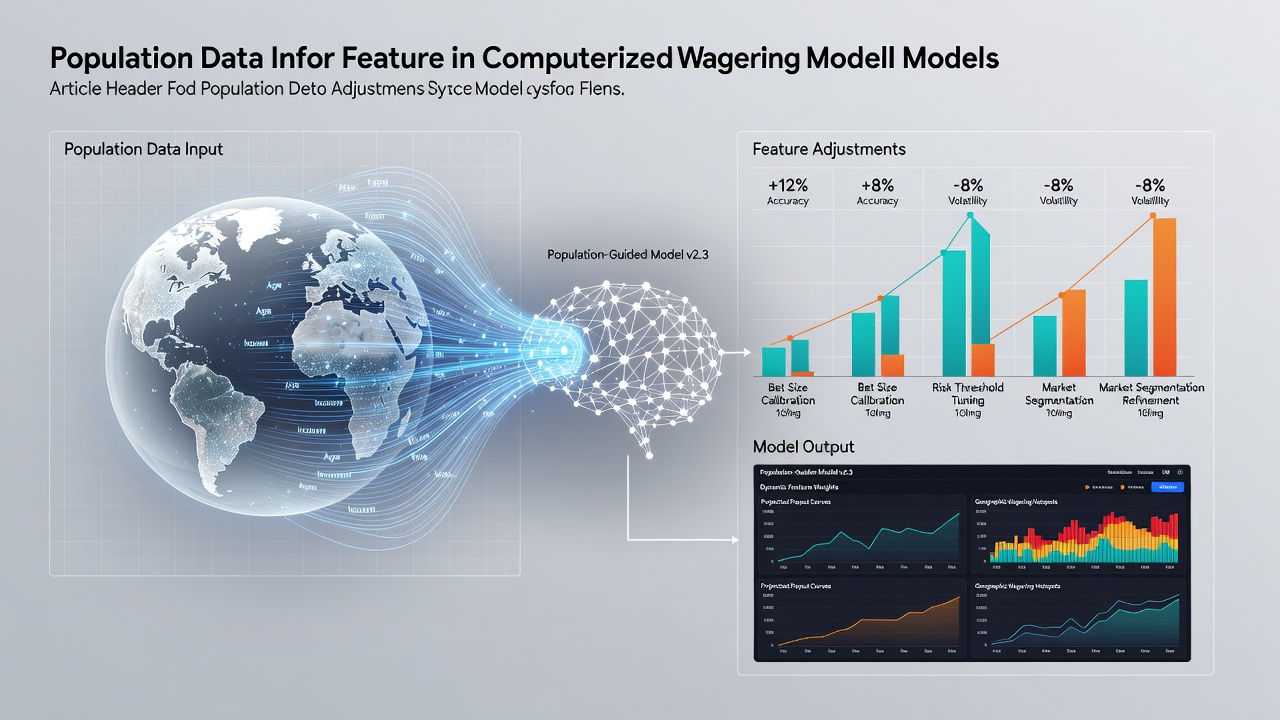
Computerized wagering models rely on structured algorithms that process player inputs, random number generators, and payout structures, while population data supplies the demographic variables that shape those adjustments over time. Census records, income distributions, age cohorts, and regional mobility patterns feed directly into the systems that determine which game mechanics receive emphasis in specific markets. Operators collect aggregated statistics from government databases and integrate them with internal performance logs to identify which features align with player groups in each locale.
Core Data Inputs and Collection Methods
Analysts pull population figures from sources such as the U.S. Census Bureau and Statistics Canada, then cross-reference those numbers against transaction volumes and session durations recorded by the platforms themselves. Age brackets, household income levels, and urbanization rates become variables that influence everything from volatility settings on reel games to the frequency of bonus triggers in live dealer environments. In August 2026, several North American operators incorporated the latest five-year American Community Survey updates, which revealed shifts in younger adult populations within mid-sized metropolitan areas, prompting targeted recalibrations of mobile interface layouts and deposit bonus thresholds.
Researchers at institutions including the University of Nevada, Las Vegas Center for Gaming Research have documented how these datasets translate into code-level changes. Population density maps help determine whether a model should increase the density of low-stakes options or emphasize progressive jackpot linkages, because higher concentrations of certain income groups correlate with measurable differences in average bet sizes and session lengths. The process remains iterative, with models retrained quarterly as fresh demographic releases arrive from statistical agencies across multiple jurisdictions.
Algorithmic Translation of Demographics into Features
Once raw figures enter the system, machine learning layers map them onto adjustable parameters such as return-to-player percentages, hit frequencies, and reward tier structures. A region showing elevated percentages of players aged 25 to 34, for instance, often sees increased weighting toward social tournament modes and shorter bonus round cycles, while areas with larger shares of older demographics receive adjustments that favor steadier base-game returns and longer play sessions. These mappings occur through supervised learning pipelines that treat historical performance metrics as labels and demographic vectors as input features.

What's interesting is how location-based data refines these models further. Urban versus rural splits, combined with commuting pattern statistics, guide decisions on session timeout defaults and push notification timing, because operators observe consistent differences in engagement windows across those segments. The adjustments stay within regulatory boundaries set by bodies such as the New Jersey Division of Gaming Enforcement and the Alcohol and Gaming Commission of Ontario, which require transparent reporting on how external datasets influence game mathematics.
Regional Applications and Observed Outcomes
European markets illustrate another layer of application, where Eurostat population projections inform adjustments to language localization and currency denomination options within the same underlying wagering engine. Australian operators, drawing on data from the Australian Bureau of Statistics, have applied similar logic to tailor responsible gaming prompts and limit-setting tools according to state-level age and employment distributions. In each case the core model remains consistent, yet the feature weights shift measurably based on the incoming demographic profile.
One documented case involved a multi-state platform that used county-level population growth rates to prioritize the rollout of new scratch-card style instant-win mechanics in faster-growing suburban zones, while maintaining traditional slot libraries in slower-changing rural markets. Performance dashboards tracked uplift in participation rates following those deployments, confirming the linkage between the data inputs and the resulting feature priorities.
Regulatory Oversight and Data Governance
Regulatory frameworks in multiple jurisdictions require operators to maintain audit trails showing how population datasets influence model outputs. These records include version histories of the weighting algorithms and documentation of any external data feeds, ensuring that changes remain traceable during compliance reviews. Industry associations such as the American Gaming Association have published guidelines that encourage standardized formats for demographic data ingestion, reducing discrepancies across different software providers.
Security protocols around these datasets emphasize anonymization and aggregation, because individual-level information never enters the wagering engines directly. Instead, statistical summaries at the postal-code or census-tract level supply the necessary granularity while satisfying privacy statutes in each operating region.
Conclusion
Population data continues to serve as a primary driver for iterative refinement within computerized wagering models, supplying measurable variables that guide feature prioritization across diverse markets. As statistical agencies release updated figures and as modeling techniques evolve, the linkage between demographic profiles and game mechanics remains a central operational practice for licensed operators worldwide.